Is there an investing strategy that one can use to profit from 2020 US Presidential Election?
2020 US Presidential Election
Historically, S&P 500 volatility has typically been higher in election years than in non-election years, as markets frequently reprice the probability of the future administration’s policies.
Since 1932, an incumbent US president has never failed to win re-election unless a recession has occurred during their time in office.
If you examine the return of the S&P 500 Index for each of the 23 election years since 1928, you'll see that in only four of them was it negative.
However, this year may not be as straight forward as the data may suggest.
4 Year Presidential Cycle
The most profitable year of a presidential cycle is the third, followed in order by the fourth, second, and first.
Based on widely published research, the 3rd year of presidential cycle has proven to be one of the best years to invest.
In fact, a research published by Marshall Nickels has a strategy to share:
Potential Investment Strategies Based on the Political Cycle
"Price data for the S&P 500 Index was compiled and averaged on a weekly basis over the period from 1942 to 2003. Analyses of these data suggest that a potentially lucrative investment strategy would have included buying on October 1 of the second year of the presidential election term and selling out on December 31 of year four. This simple strategy would have sidestepped practically all down markets for the last 60 years."
Here are the results from their research:
The research continued to conclude that "Investor 1 saw the original investment of $1,000 grow to $72,701. This is a percentage gain of 7,170 percent. Investor 2 was not so fortunate. This individual also anted up 13 times, but lost six times. The largest loss of -36 percent was seen after the presidential election of 2000. Investor 2 saw the original $1,000 shrink to only $643, or a loss of -36 percent, in nearly five decades."
That's a powerful strategy. You can access the entire research report here.
The time for the strategy was from 1 Oct 2018 to 31 Dec 2020 and now that time is almost over.
COVID-19
There are more headwinds this year.
A true black swan event, Coronavirus or COVID-19 has shocked entire world. Countries are in lock-downs, markets crashed, GDP sharply contracted and millions of people have lost job. This is going to significantly affect companies ability to produce quick profits and thus we might see a technical recession of the same level, if not more, as 2008/09.
The real unknown in COVID-19 is:
- What happens when lockdowns are over, economies are open and people start going out. Will it spread more? or Will it be contained?
- The impact of COVID-19, imho, is far from over, and we don't yet know the whole impact as most countries are still closed and there aren't many indicators to measure true demand/supply impact of this very unique event.
SELL in May and Go Away
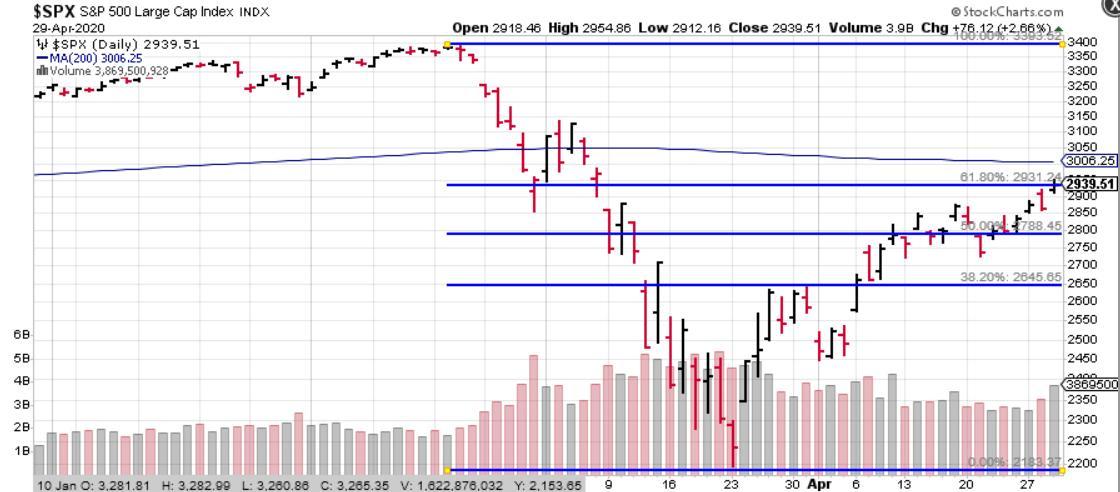
COVID-19 crash resulted in stock market seeing steepest pullback in the history. In just matter of 4 weeks, S&P dropped almost 34% before bouncing back due to unprecedented intervention by the Federal reserve. Trillions of dollars have been pumped into financial markets and stock markets have rallied furiously since making the low on 23 Mar 2020.
With that in perspective, we are now entering into seasonally weaker period.
Monthly S&P 500 data compiled from January 1928 through March 2020, which shows an average November-April return of 5.1%, versus just 2.1% for May-October.
Then there are other data that points to weaker May to Oct if it is preceded by weak Nov to Apr period. Nov 2019 to April 2020 wasn't a positive period.
Bottom Line
Overall, as we move towards 2020 US presidential elections, from stock market perspective, we have 3 negatives, and 2 positives.
- Negatives: COVID-19, Potential Recession and Statistically weaker May-Oct.
- Positives: Statistically positive Presidential Year and Unprecedented market intervention by US Fed.
In such a situation, I would prefer to wait for S&P500 to clear 200 days moving average, which is 3,000+/- as of this writing when SPX is at 2,920.

At just about 100-200 points upside with significant headwinds, the risk/reward ratio favours a wait & watch strategy, at least for short term, with slight bearish bias at these levels.
Positive volatility options strategies such as Calendar Spread, or Bearish condors can bring high yield during such indecisive and weaker markets.
In fact, a Put Diagonal spread on SPY around 275/290 zone with short leg at 2 week expiry against 3month long leg expiry could also generated positive alpha during these periods.
Should you have any questions or would like to know, feel free to join conversation by asking a question or leaving a comment below.
Happy Trading.
Get Free Access to The Market Insider's Newsletter:
Want behind-the-scenes stock & options strategies and actionable insights delivered biweekly to your inbox? Join 40,000+ savvy investors and start growing your wealth!
*We send you weekly goodies to help you make more money. Unsubscribe anytime.


